I am very much a verbal thinker—I understand a problem by reading, talking or writing about it—but I'm becoming increasingly persuaded of the value of clear, appealing images. They can be a very powerful supplement or even replacement for a mass of words, and serve many purposes:
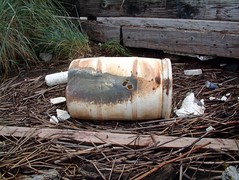
Emotional engagementI know I'm not the only one who has put energy into a sustainability issue, become emotionally involved, and then had trouble explaining to other people why I cared so much. For example, I was a
Sound Steward for a couple of years, which involved adopting one of
People for Puget Sound's habitat restoration sites, and making repeated visits to monitor and maintain the site. It's a brilliant program, both because channels volunteer labour to an important project and because close involvement with a specific site encourages the stewards to get emotionally involved. I became a sworn enemy of blackberry brambles, but had a hard time explaining to people just how much of the damage to this site was caused by human carelessness. Listing the astonishing array of trash that washed up was mindnumbing, so it was much easier to just show people:
Showing contrasts over timeA lot of the ideas we try to explain about sustainability are about contrasts over time: what we have today compared to what we've lost, or what we could have if we were collectively smarter. The scale of these changes over just a few generations can be very hard to grasp, so images can be a very powerful tool. One of my all-time favourites is Sightline's astonishing map of how far humans have shrunk the grey wolf's habitat:
Demonstrating scaleAnother challenge as a sustainability advocate can be conveying the collective impact of 6 billion people. So many of the behaviours we ask people to change are meaningless on their own, but become powerful when enough peoples' actions add up. The trouble is, once we start listing huge numbers, they become difficult for anyone to grasp what they mean, so help is needed. Local artist Chris Jordan has a very powerful approach to this:
Running The Numbers.
Relative numbers can also be hard to put into context, and a good image can go a long way. For example, groups with a financial interest in obstructing meaningful climate change action like to talk about the thousands of scientists who have signed their petition. It sounds very impressive without its context, but a single image can clearly show what a drop in the ocean those signatures really are:
Extracting wisdom from dataFinally, the process of making the right image can help us to understand what's really going on behind a mess of statistics. One of the classic examples of this was by a British doctor, John Snow, who seems to have been the first person to prove that unsanitary water spreads cholera. In the midst of an outbreak, he plotted the sites of all the cases on a map, and from that map came the insight that these incidents were all linked; an insight that was crucial to ending that outbreak and learning to control cholera ever since. For more on this story, I strongly recommend Steven Johnson's website, videos and book:
The Ghost map.
Come and learn more with usAll of these are reasons why I'm excited about a new seminar we have just launched:
Visualization Tools for Sustainability. The first session will be in the afternoon of May 4th, at the downtown Seattle Library, and you'll be able to learn more about making and using visualizations to tell stories about sustainability.